Navigation: Reports > Statistics Overview >
Charts


|
Navigation: Reports > Statistics Overview > Charts |
|
In this section you can view monthly graphical representation of total pages viewed, unique hosts and sales in US Dollars.
To view this data, follow the steps:
1. Click Charts, as shown in the Figure 7-1-1 below.
Figure 7-1-1: Charts
2. The Charts page will open, as shown in the Figure 7-1-2 below.
Note: You can also open the Charts page directly by clicking on Charts link in the Admin Area Home page.
3. In the Charts page, under Select Period & Charts Type, select a month, year and chart type (Bars, Lines, Dots, etc.) from the drop-down menu.
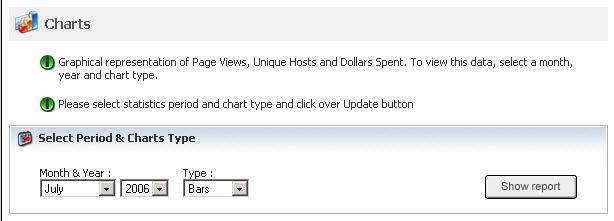
Figure 7-1-2: Charts Page
4. Click Show report button.
5. The graphical representation of the selected month & year will open, as shown in the Figure 7-1-3 below.
Figure 7-1-3: Graphical Representation